Tableau is one of the leading data visualization tools. And I have many beginners looking for the tableau projects for practices.
If you’re new to Tableau, I recommend you check some best Tableau books. Or if you want to learn Tableau online, you can follow the link.
Here we have shared a detailed course considering the person completely new to the technology.
So, if you have done some course on Tableau or if you’ve learned on your own and looking for the project, this post is for you. Here we have shared Tableau projects for practices.
Tableau projects for practices
The tableau projects for practices I am going to share today is related to the sample superstore dataset we have. If you’re not sure what is this dataset, then you can follow this path-
C:\Users\user_name\Documents\My Tableau Repository\Datasources
This is the default Tableau location (if you’ve not changed) so far. Here you can select the folder as per your Tableau version and find the file. If still, you have an issue looking for the file, you can download it from below link.
Tableau Project Overview (Requirement)
General Requirements
- Dashboard size is 1250px wide by 750px tall.
- Prefer using containers
- The dashboard has a total of 5 containers (no more, no less)
- The Filter Pane
- Each filter has some padding
The Charts Pane Requirement
- All 3 charts must be in one vertical container
- Do proper formatting
- Each chart has some padding between them and other objects
- Each chart has a grey border, slightly darker than the Pane background color.
- The Pane under the Title has a border
Business Requirements
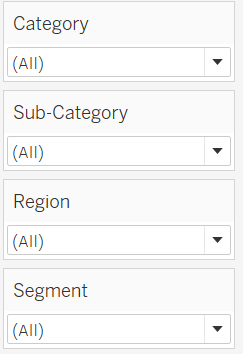
- Show four filters- Category, Sub-Category, Region, and Segment. These filters should have only relevant values.
- The dashboard should have the title “Executive sales”
- The first chart should have the title “YTS KPIs” and should show the following-
Total Discount
Overall Profit
Total Quantity and
Total Sales - The second graph should have the title as “Sales” and should show monthly sales per year. Make sure it is an area chart with proper formatting.
- The third graph should the title as “Profit” and should show monthly profit per year. Make sure it is an area chart with proper formatting.
- Do proper formatting so that it can look professional
Tableau Project Expected Solution:
After creating the dashboard, we should be getting the dashboard something like below-
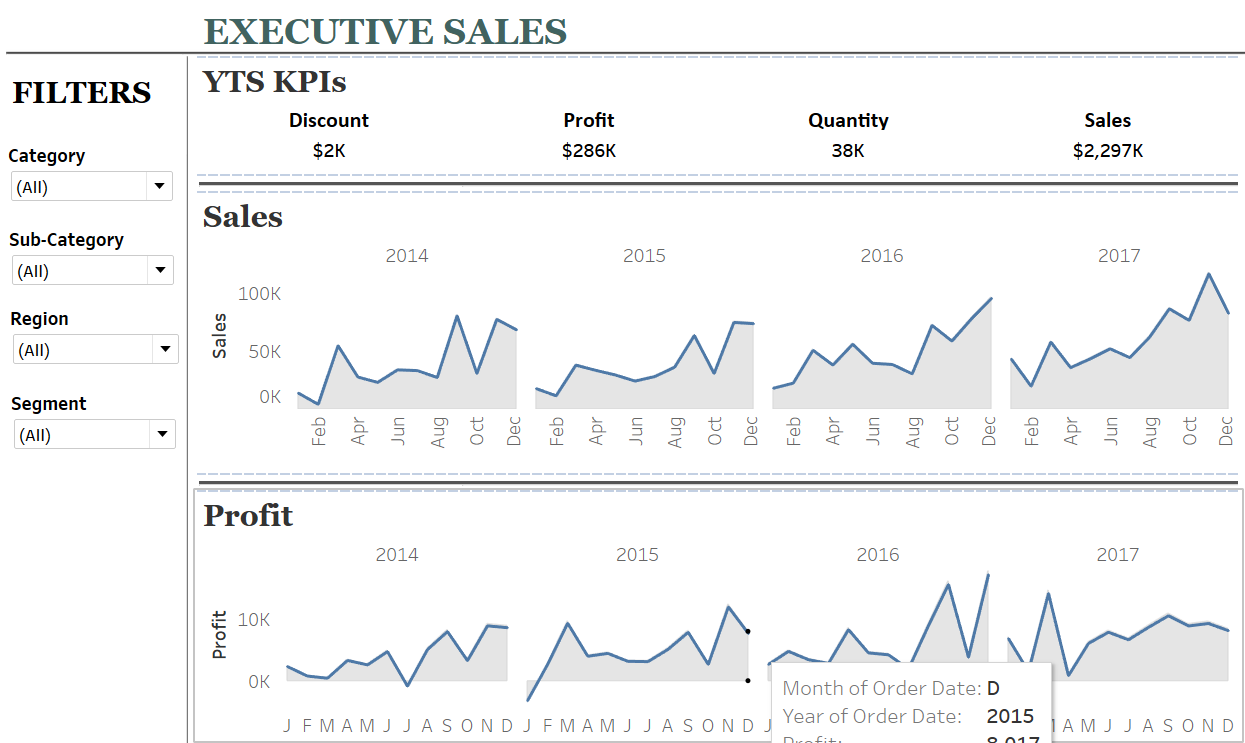 Tableau project Explanation for Practice Solution
Now let’s start and see how to solve this Tableau sample free project. We’ll go step by step and develop this project as per the requirement.
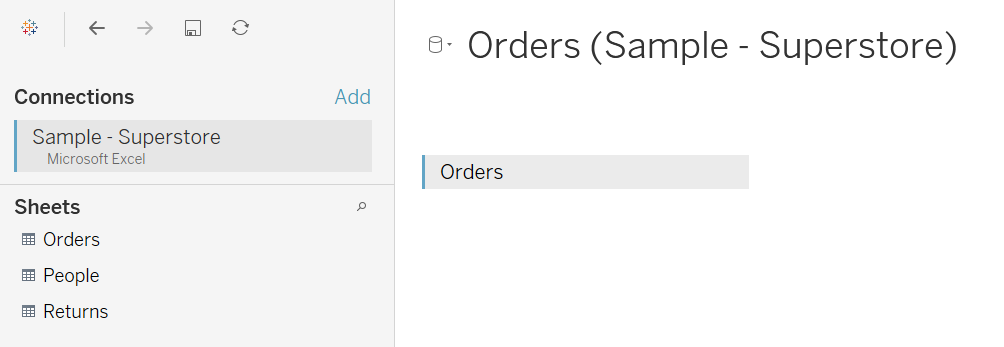
Step 1: Data source connection
First, connect the sample superstore dataset to Tableau and select the “Order” sheet.
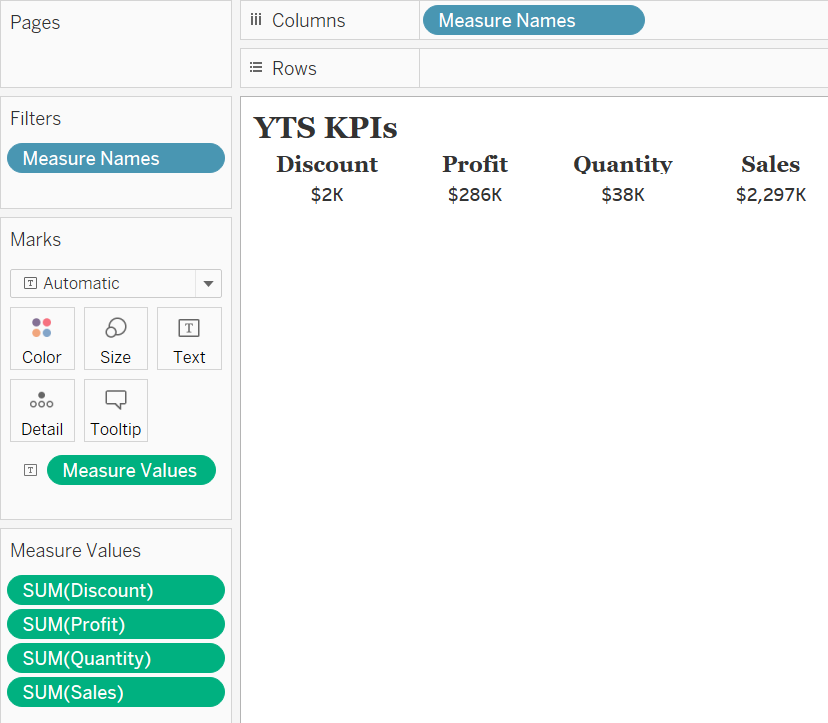
 Step 2: Create First Tableau worksheet
Now go to sheet 1 and start creating the first graph as explained in the 3rd point of business requirement. Here you can use “measure values” and “measure names” to accomplish this. Once done, make a little decoration and you should get something like below-
 Step 3: Add Filters in Tableau
Here we’ll add all the filters as per the requirements shared. Please check #1 of business requirements.
 Step 4: Create an area chart in Tableau
In this step, we’ll touch base with the 4th point of business requirement. Here, if you carefully look into the solution, it is area chart along with border in Tableau. So, let’s create an area chart in Tableau and make some formatting to get something like below.
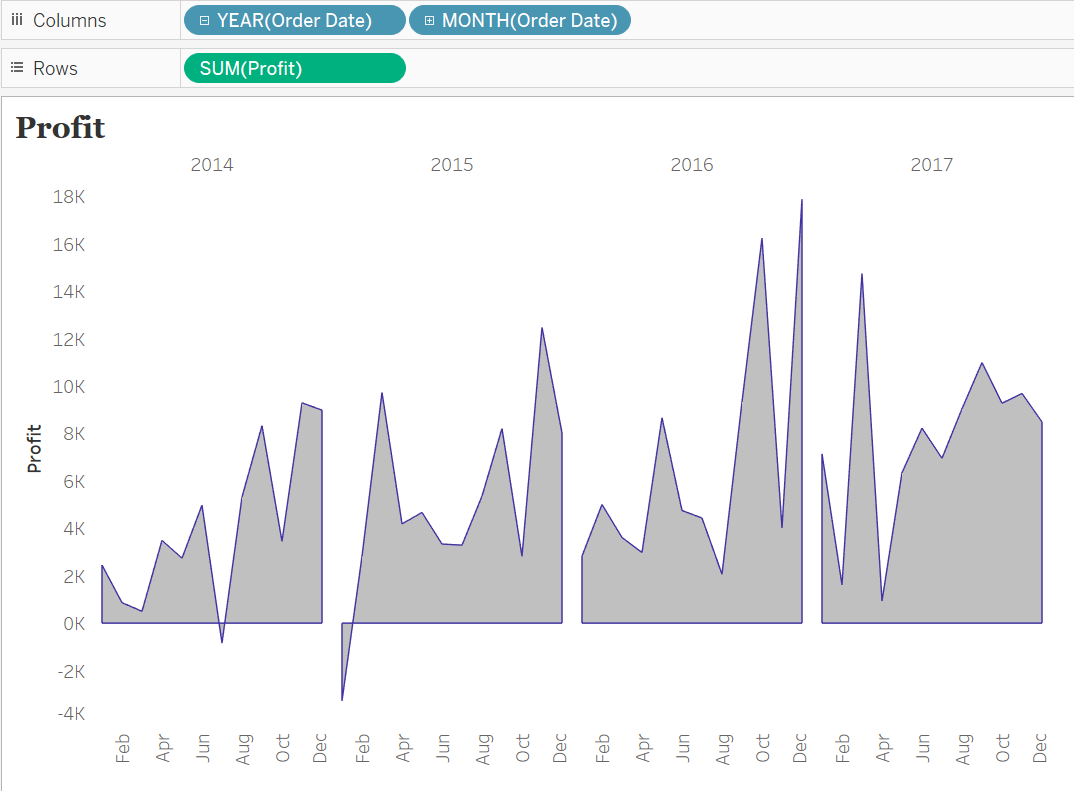
 Step 5: Create an area chart in Tableau for Profit
In this step, we’ll touch base with the 5th point of business requirement. Here, if you carefully look into the solution, it is area chart along with border in Tableau. So, let’s create an area chart in Tableau and make some formatting to get something like below. This is similar to step 4 and just sales will be changed to profit.
 Step 6: Create a Dashboard in Tableau
Now we’ve come to the last section of this tableau projects for practices. Here we need to simply arrange the three tableau worksheets and provide proper formatting along with the border. Here we need to consider chart pane requirement and general requirement sections. Also, enable the dashboard title as shared in the requirements.
If you got any issue, here is the video explaining the solution-
Conclusion
This was all about the tableau projects for practices. I hope you have followed the steps and were able to create this dashboard. If you got any issue, feel free to share that in the comment and our team will reply with the solution.
If this tableau projects for practices helped you, please subscribe us and share this with others.


GOOD PROJECT….
I need many sample projects like above, is this possible. If so, could you please share some projects..
Thanks
Kumar